

hide
Why “Quality Control in Logistics” Matters More Than Ever
What ISTA Testing Intends to Measure—and Why It’s Only Part of the Picture
When “Shipment Damaged in Transit” Becomes a KPI
Shipping Quality Control Gets Real with Visual Evidence Impact Indicator 2
Delivery Quality: The Final Mile of the QA Journey
How QA/QC Managers Benefit from Impact Indicator 2
Quality control in logistics, shipment damaged in transit, ISTA testing, shipping quality control and delivery quality are not just buzzwords—they represent the very landscape that quality assurance and quality control managers must master today.
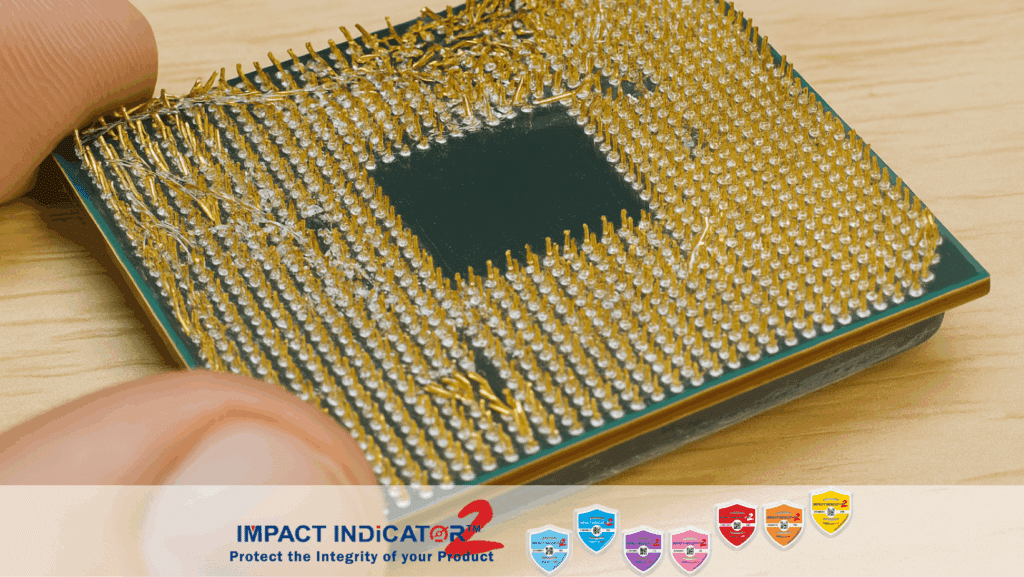
Imagine Samantha, the QA manager at a high-tech electronics manufacturer. She’s spent countless hours optimizing production lines, refining inspection checklists, and ensuring that the products leaving the plant are flawless. But one day, a customer returns a pallet of circuit boards—many units with cracked substrates, bent pins, and no visible explanation of how they were damaged. Samantha knows the fault likely didn’t occur in the factory—so where did it happen? That moment crystallizes a truth: quality doesn’t stop at the factory gate. It extends all the way to the customer’s doorstep.
In the past, Quality Assurance and Quality Control roles were mostly focused on manufacturing processes—spends on incoming materials, assembly defects, final inspection. But today’s supply chains are global, complex, and include multiple handling points, long-distance transport, and multiple modes (sea, air, road). That means the risk of shipment damaged in transit has grown significantly.
According to industry standards such as those from the International Safe Transit Association (ISTA), packaging must be tested to simulate real-world shipping hazards. For QA/QC managers, this means that shipping quality control and delivery quality are equally part of the job as process control at the factory. If a product arrives with damage, the brand suffers, customer satisfaction drops, and the QA team’s metrics are under pressure.
Samantha realized that the return wasn’t just a blemish—it was a systemic issue. She engaged her team to trace the damage cause. Was it loading in the truck? Was the packaging design inadequate? Were vibrations during sea-route too high? Without proper data, it was a guessing game.
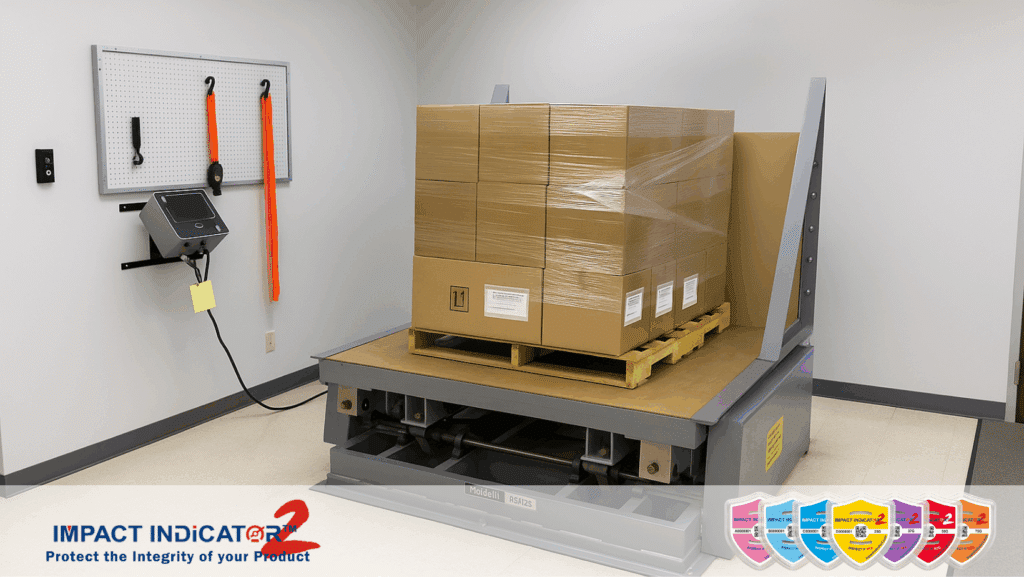
ISTA testing (such as Series 1, Series 2, Series 3) is designed to simulate transport hazards: drops, vibrations, compression, environmental stresses. Packaging engineers use these tests to validate designs before volume shipment. But here’s the catch: passing a lab-based ISTA test doesn’t guarantee faultless real-world performance.
When Samantha looked at the lab reports, the packaging passed ISTA protocols—but damage still occurred. That’s because the factory saw only standard shipping conditions, whereas the real transport involved multiple transfers, poorly maintained pallets, and a last-mile carrier with rough handling. Many QA/QC managers find that shipping quality control in live conditions reveals more than controlled lab tests can show.
This is why QA professionals are now asking for external verification tools that monitor actual shipments—tools which allow them to validate that what left the factory still arrives intact. Something that bridges the gap between lab-validated packaging and real world results.
For Samantha, the return event triggered three alarms:
As a QA/QC manager, she is measured on metrics like defect per million (DPM), return rate, customer complaints, and now increasingly, damage during transport. That makes quality control in logistics a crucial dimension of her role.
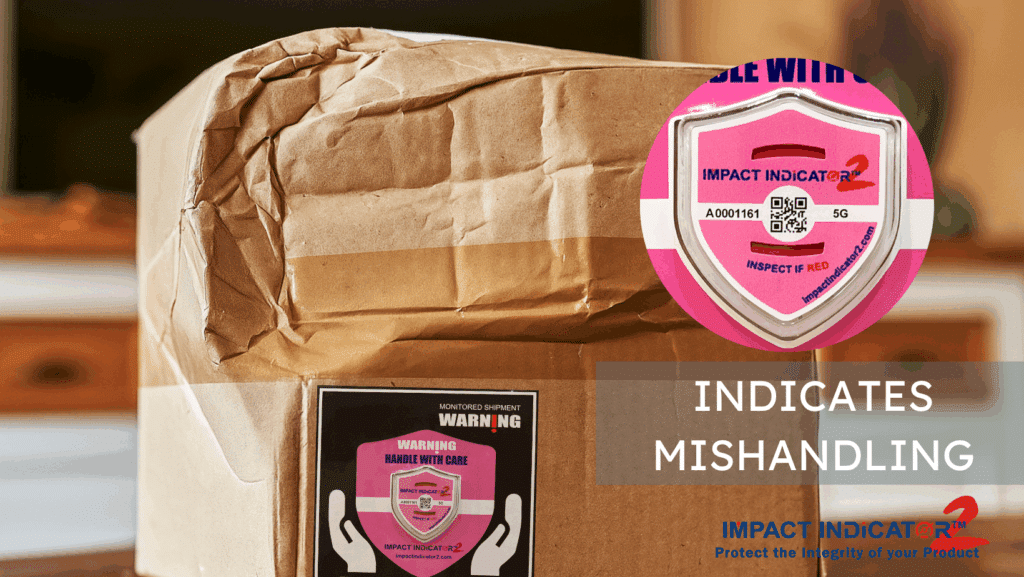
The trouble is: by the time damage is reported, the shipment is gone, and the only data available is the damaged item—even then, the root cause is uncertain. Enter: the Impact Indicator 2—a simple, low-cost, highly scalable tool that provides visual evidence when a package exceeds a pre-set shock or impact threshold in transit. By including it in outgoing shipments, QA/QC managers can quickly verify whether damage occurred in-transit or post-delivery.
Let’s fast-forward to Samantha’s next shipment of sensitive components. She decides to equip every pallet with the Impact Indicator 2, which is formally authorized by ShockWatch—meaning it meets the same performance expectations but is designed for large-scale deployment. In doing this, she achieved:
QA/QC managers who adopt such monitoring tools are shifting from reactive inspection to proactive control. They can braid shipment damaged in transit metrics into their dashboards. They start measuring not just defects from manufacturing but damage from distribution.
When your customer opens a box and finds a crushed component, your brand suffers—even if everything upstream was perfect. Here, delivery quality becomes the ultimate test of your company’s promise. For QA/QC teams, safeguarding delivery is the last mile of guarantee.
With the Impact Indicator 2, Sophie the QC team lead now receives data not just from internal inspections but from live shipments. They segregate any pallets where the indicator triggered, immediately liaise with logistics, and isolate the root cause. Over time, this process significantly reduced their shipping-related quality issues.
By instituting a rule: “Any pallet that leaves our factory must have an indicator,” the team built a culture of accountability across manufacturing, packaging engineering, logistics, and quality. And that culture boosted their delivery quality and customer loyalty.
Without in-transit monitoring, QA/QC work often goes: “We found damage—what happened?” With visual indicators placed on every shipment, it goes: “Indicator triggered at kilometer 238 of transit—here’s the data; next step: trace carrier handling or pallet stacking.”
Damage during transit is costly—not only in product loss but in customer claims, re-shipping, and brand erosion. QA/QC teams using the Impact Indicator 2 show management that “we reduced shipping-related returns by 40% in one quarter,” translating directly to cost savings.
Traditionally, after passing ISTA testing, packaging moves to volume production with confidence. Now, QA/QC teams layer live-data monitoring and see how packages perform in actual shipping environments. The data from indicators feed back into packaging engineers' redesign loops, elevating shipping quality control to a new level.
Quality assurance now includes supply chain visibility. Impact Indicator 2 serves as one piece of the compliance puzzle—helping QA/QC teams demonstrate to auditors that “we monitor after factory”—meeting modern requirements for traceability and distribution control.

At OmniTech Electronics, packaging returns were spiking. The QA/QC team hired outside labs, ran ISTA 3A tests, and improved packaging strength—but returns kept rising. They then installed Impact Indicator 2 on each outbound pallet for three months. During that period, 12% of pallets triggered indicators. Investigation revealed one subcontracted carrier consistently dropped pallets during last-mile. With that evidence, OmniTech switched carriers, retrained staff, and optimized palletization. Six months later, return rate dropped by 65%, and QA metrics were back on target. That shift from “we hope the packaging works” to “we know it works” transformed their QA mindset.
For the modern QA/QC manager, excellence isn’t achieved at the end of production—it’s proven when the product arrives intact at the customer’s door. By embracing tools like Impact Indicator 2, your team extends quality control in logistics, guards against shipment damaged in transit, and elevates your delivery quality to world-class standards. Pairing lab-validated ISTA testing with live-shipment monitoring creates a robust shield against damage and the data to back it up.

Ready to prove your quality all the way to delivery? Contact us now for a free sample kit of Impact Indicator 2 and start turning every shipment into a data-driven assurance of performance.