hide
Why Protective Packaging Design Alone Isn’t Enough
The Hidden Cost of Ignoring Packaging Trends
Packaging Engineers as Data Storytellers
Why Impact Indicator 2 Wins Over Data Loggers
Future Packaging Trends Engineers Must Watch
How to Cut Packaging Costs Without Cutting Corners
Your Next Move as a Packaging Engineer: High Quality Pacakaging
Protective packaging design, high quality packaging, reduce packaging costs without damage, packaging trends, and packaging costs—these five phrases probably appear daily in every packaging engineer’s mind. Whether you’re tasked with redesigning a crate for fragile EV battery modules, ensuring server racks survive international flights, or defending your company against escalating logistics expenses, the balancing act is the same: How do you keep things safe without breaking the bank?
And here’s the twist: it’s no longer just about foam, corrugate, or bubble wrap. In 2025, data-driven packaging is the name of the game. With supply chain risk analysis packaging becoming a standard practice, packaging engineers are now expected not only to design smarter boxes but to improve packaging efficiency with tangible proof. And this is exactly where the Impact Indicator 2—fully authorized by ShockWatch—steps in as the secret ally engineers didn’t know they needed.
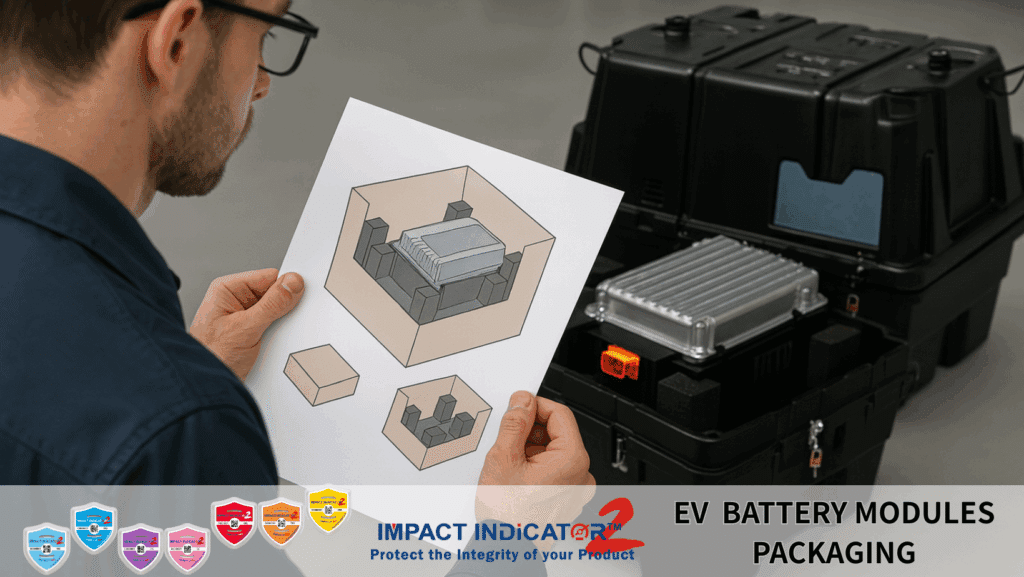
Packaging engineers are artists of structure. You model drop angles, compression points, vibration frequencies, and material absorption. But here’s the challenge: even the best protective packaging design can fail in the real world. Forklifts tilt pallets too hard. Cargo handlers drop boxes off a truck ramp. Containers cross oceans through storms.
You could design what you believe is high quality packaging, but without feedback from real-world transit, you’re left with educated guesses. And in today’s packaging trends, educated guesses are not enough—stakeholders demand evidence.
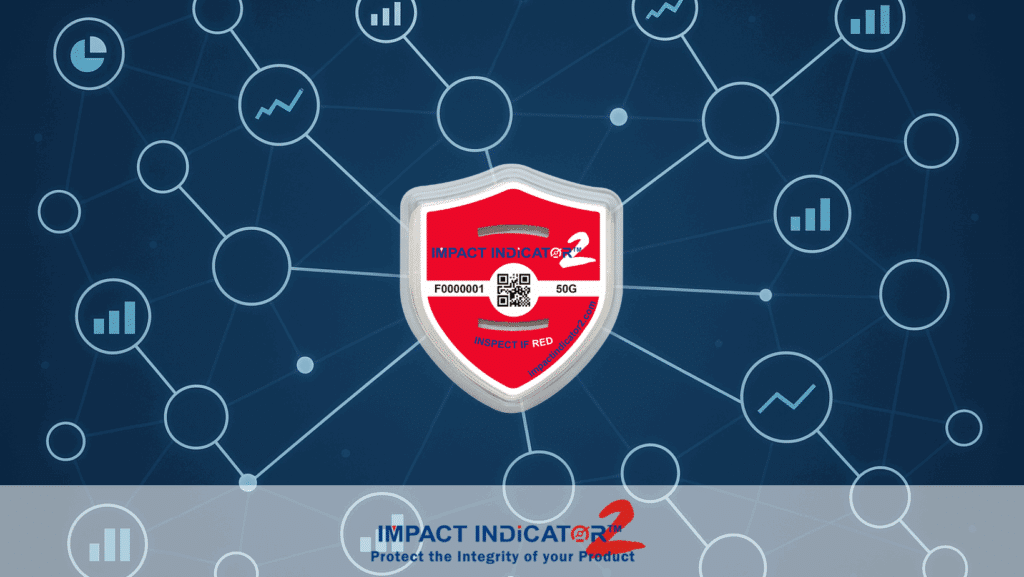
This is where Impact Indicator 2 plays a surprisingly disruptive role. Unlike expensive data loggers, this simple yet ingenious shock label indicator gives you widespread, low-cost visibility. You can place dozens—or hundreds—across shipments, creating a massive sample size that reveals where packaging is underperforming.
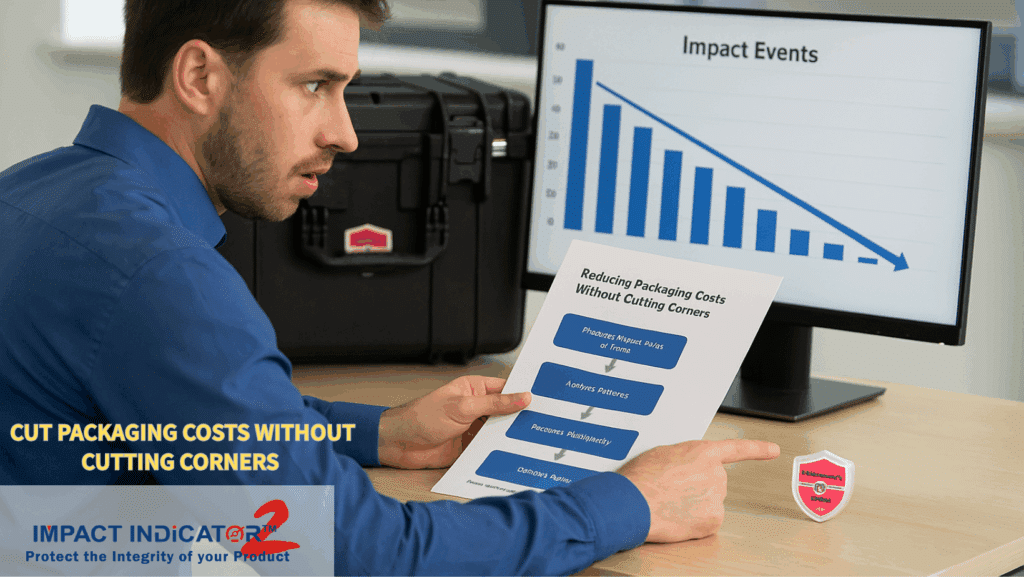
Let’s pause for a reality check. Packaging costs are rising—raw material inflation, sustainable material sourcing, and regulatory compliance are squeezing budgets everywhere. The instinct? Cut corners. But every packaging engineer knows cutting corners leads to catastrophic damages that cost far more in replacements, claims, and brand reputation.
Here’s where reduce packaging costs without damage becomes the holy grail. It’s not about slashing materials blindly—it’s about optimizing through knowledge. Imagine having supply chain risk analysis packaging data telling you:
Without indicators, you might redesign unnecessarily, overspending on high quality packaging that doesn’t solve the actual problem. With Impact Indicator 2, you can validate your designs with undeniable field evidence—and that saves both time and money.

Once upon a time, engineers designed packaging, shipped it, crossed their fingers, and waited. Today? Packaging engineers must tell stories with data.
This is where Impact Indicator 2, authorized by ShockWatch, becomes your narrative tool. Each triggered indicator is a plot point. Each shipment becomes a chapter. Collect enough chapters, and suddenly you’re not just presenting corrugate strength tables—you’re presenting a story of resilience backed by numbers.
For example:
That’s not just improve packaging efficiency; that’s engineering storytelling in the era of ESG and supply chain accountability.

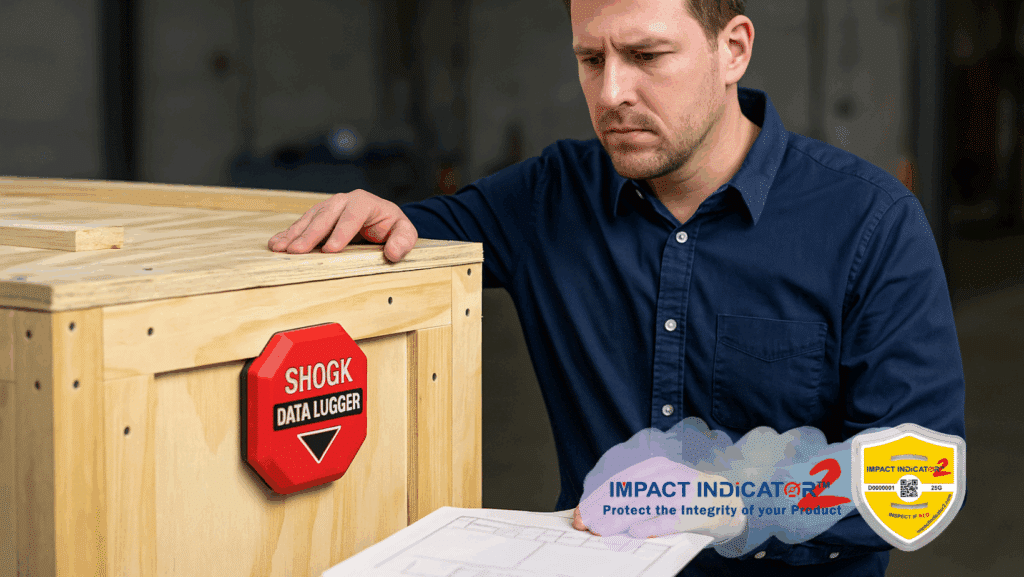
Let’s address the elephant in the room: shock data loggers. They’re precise, digital, and impressive. But here’s the catch: they’re expensive, often costing 10x or more per unit compared to Impact Indicator 2.
As a packaging engineer, you don’t need a few highly detailed datapoints—you need a wide net of insights. You need 200 indicators across pallets, not 2 loggers. You need to know how your packaging behaves in real operating conditions, across diverse routes, handlers, and climates.
This is exactly why Impact Indicator 2 outshines loggers in large-scale packaging validation:
It’s the difference between surveying 3 people for feedback versus 300. The data logger may give more detail, but the Indicator gives more truth.
Packaging engineers stepping into 2025 need to keep an eye on five trends:
These packaging trends aren’t buzzwords—they’re survival strategies. And the engineer who ignores them risks being left behind.
So how do you actually reduce packaging costs without damage? The formula looks like this:
This loop is how companies report not only high quality packaging, but also lower packaging costs and fewer customer complaints.
As a packaging engineer in 2025, your job is no longer just about boxes. It’s about credibility, sustainability, and cost control. Your stakeholders expect proof. Your customers expect high quality packaging. Your CFO demands reduced packaging costs.
And now, you have the simplest, most scalable tool to achieve it: Impact Indicator 2, authorized by ShockWatch.
Don’t let packaging costs spiral or gamble with fragile cargo. Start your next project with Impact Indicator 2 and show your team what data-driven protective packaging design really looks like.
Contact us today to request your free sample pack of Impact Indicator 2.